There are currently 3 levels of script to generate and run EF partitions. The first 2 levels are used to generate the configurations. The top level uses the bottom 2 levels to automatically generate many different configurations, run them and take timing measurements. This document describes how to use the scripts.
The configurations generated are standalone EF partitions which use SFI
and SFO emulators. The SFI emulators generate dummy data which is sent to
the EFD applications in the EF which forward the events to dummy PT applications
(i.e. PTs which do not run physics algorithms - but simply run implement
a configurable "burn time" and acceptance rate. The events are passed back
to the EFD and then forwarded to the SFO emulators (they are not written
to disk). The normal configuration is 1 EFD and ~4 PTs per processing node.
But multiple EFDs can be run per node in order to simulate larger systems.
The EF is split into a number of sub-farms. These will probably consist of
~30 processing nodes per
sub-farm. However, one of the main aims of the large scale tests is to
investigate how sub-farm configuration (number of sub-farms, number of nodes
per sub-farm) affect system performance.
The first aim of the large tests is to verify that various EF configurations may be cycled through the entire DAQ FSM (finite-state machine) without error. That is it must be possible to launch all EF applications, configure them, bring them to the running state, stop them running, unconfigure them and subsequently terminate them.
Once this funtional testing is done, the next step is to make timing measurements
for each of the various state variations for a sample of
representative configurations. The configurations can either be generated
manually or automatically using the highest level script.
Checks on the dataflow behaviour of large-scale EF configurations can be made. For a number of large scale configurations it should be verified whilst in the "running" state that all PTs are receiving events, and assuming that each sub-farm is of a similar size and homogeneous, the total event throughput of each sub-farm is approximately equal.
Finally a long term stability test could be made with a couple of representative large-scale configurations to verify that event throughput stays approximately constant over time.
The following sections describe in detail, how to generate and run standalone
EF configurations.
IMPORTANT DISCLAIMER:
The scripts described in this document are under active development and
their current form is due to rather disorganised evolution over the last months.
We hope to be revise the scripts over the summer into a more coherent structure.
In the meantime, the method might not be very beautiful, but it works. Obviously
all constructive feedback on how to improve the procedure and ease-of-use
of the scripts is welcomed (contacts are Per Werner, Gokhan Unel, Sarah Wheeler).
Note: I'm assuming tcsh throughout.
1. Download combined release tdaq-01-01-00 from: http://atlas-onlsw.web.cern.ch/Atlas-onlsw/download/download.htm and install all the patches. Bryan has already installed tdaq-01-01-00 and patches in his home directory on WestGrid (this includes a private patch from Marc to solve the pmg problem caused by the underscore in the name of the ice nodes):
/global/home/caronb/atlas/tdaq-release/tdaq-01-01-00/installed
2. The database generation scripts are in the DBGeneration package but are not up-to-date in the release. They need to be checked out from cmt and changed slightly. Bryan also has information on how to check out from cmt locally (i.e. from a machine without direct afs access). Perhaps he could provide a link' Here is a recipe to do this from scratch:
Setup cmt for the tdaq-01-01-00 release (this must be done from a machine with CERN afs access):
source /afs/cern.ch/atlas/project/tdaq/cmt/bin/cmtsetup.csh tdaq-01-01-00
make a working directory, e.g.
mkdir ~/DC
check out DBGeneration package into it (this has been under active development - so I suggest you check out a specific tagged version, v1r1p33, which has been tested and is consistent):
cd ~/DC
cmt co -r v1r1p33 DAQ/DataFlow/DBGeneration
For running on WestGrid you will have to make some small changes.
The HW_tags in gen_nodes.py need to be set back to RH73, every instance
of:
<attr name="HW_Tag" type="enum">"i686-slc3"</attr>
should be changed to:
<attr name="HW_Tag" type="enum">"i686-rh73"</attr>
In gen_partition.py you will need to add a value for the RepositoryRoot
to pick up the following private patches currently installed in my home
directory on WestGrid:
Replace:
'<attr name="RepositoryRoot" type="string">""</attr>'
with:
'<attr name="RepositoryRoot" type="string">"/global/home/swheeler/InstallArea"</attr>'
For operational monitoring, the Gatherer segment should be included when the database is generated, modify gen_db.sh to include the Gatherer .xml file:
echo '<info name="" num-of-includes="5" num-of-items="'$objs'" oks-format="extended" oks-version="3.0.0" created-by="gensetup scripts" />'
cat <<EOF

<include>
<file path="DFConfiguration/schema/df.schema.xml"/>
<file path="DAQRelease/sw/repository.data.xml"/>
<file path="daq/segments/setup.data.xml"/>
<file path="DFConfiguration/data/efd-cfg.data.xml"/>
<file path="DFConfiguration/segments/gathLocalhost.data.xml"/>
</include>
Make sure the segment is included (but disabled - instructions on how
to enable it come later in operational monitoring section) in the partition,
change (this is a hack - really should change to number_of_segments+1, but
I don't know python):
    #contains
    print ''' <rel name="Segments" num="%d">''' % len(segments)
    for seg in segments:
        print '''  "Segment"''','''"'''+seg+'''"'''
    print ''' </rel>''',
to:
    #contains
    print ''' <rel name="Segments" num="2">'''
    for seg in segments:
        print '''  "Segment"''','''"'''+seg+'''"'''
    print '''  "Segment"''','''"gathLocalhost"'''
    print ''' </rel>''',
To make sure it is disabled, change the line:
<rel name="Disabled" num="0"></rel>
to:
 <rel name="Disabled" num="1">
  "Segment" "gathLocalhost"
 </rel>
Note: I have already checked out copied and made the above changes to v1r1p33 of DBGeneration and you may find it in my home directory on WestGrid:
/global/home/swheeler/DC/DBGeneration
The DC directory also contains some other directories which are needed
by the create_ef.bash script which is described in the next section (multihost
partition).
3. Go to the gensetupScripts sub-directory of the DBGeneration package and look for the file: input_ef_localhost.cfg. This file is the input to the first-level database generation script. It is currently configured to create a localhost configuration to run on nunatak2.westgrid.ca. If you want to run on a different host change nunatak2.westgrid.ca to the hostname. Note that the hostname must be the same as the result of the 'hostname' command on the machine on which you wish to run and may or may not be qualified with a domain name, e.g.
nunatak1|swheeler|55> hostname
nunatak1.westgrid.ca
ice17_13|1> hostname
ice17_13
If this is not correct the pmg_agent will not be able to start when you
try to run your partition.
4. In the same directory type:
./gensetup efTest input_ef_localhost.cfg
This will generate the part_efTest partition in the part_efTest.data.xml file.
5. Setup the combined release by running the script in the tdaq release installed directory e.g.:
source /global/home/caronb/atlas/tdaq-release/tdaq-01-01-00/installed/setup.csh
6. Define the following environment variables:
setenv TDAQ_PARTITION part_efTest
setenv TDAQ_DB_PATH $YOUR_DB_PATH:$TDAQ_DB_PATH
setenv TDAQ_DB_DATA $YOUR_DB_PATH/$TDAQ_PARTITION.data.xml
setenv TDAQ_IPC_INIT_REF file:$YOUR_IPC_DIR/ipc_init.ref
Note that the use of environment variables has changed in this release
(it is somewhat simpler than before). For more information read the release
notes available from the download page. For instance the .onlinerc file
is no longer used.
When there is no shared file system or you do not wish to use it, the ipc
reference can be written straight into the TDAQ_IPC_INIT_REF environment variable.
The recipe is the following. After first having run the tdaq setup script
and before running play_daq, start the global ipc server, giving it the port
number to use. In this case 12345.:
ice35_11|gensetupScripts|11> ipc_server -P 12345 &
[1] 23237
ice35_11|gensetupScripts|12> 8/4/05 12:51:49 :: ipc_server for partition "initial" has been started.
Make the reference, giving the machine name and port number and set the TDAQ_IPC_INIT_REF environment variable to this value:
ice35_11|gensetupScripts|12> ipc_mk_ref -H ice35_11 -P 12345
corbaloc:iiop:ice35_11:12345/%ffipc/partition%00initial
ice35_11|gensetupScripts|13> setenv TDAQ_IPC_INIT_REF corbaloc:iiop:ice35_11:12345/%ffipc/partition%00initial
Note: you can use the ipc_ls command to find the list of applications registered with the ipc_server and where they are running with the following command (call it with -h option for explanation):
ice35_11|gensetupScripts|14> ipc_ls -a -l -R -t
Initial reference is corbaloc:iiop:ice35_11:12345/%ffipc/partition%00initial
Connecting to the "initial" partition server ...done.
Getting information for the "initial" object...done.
Getting list of partitions ...done.
Getting list of object types ...done.
initial          ice35_11 23237 swheeler 8/4/05 12:51:49
7. If you want to browse the configuration use the oks_data_editor:
oks_data_editor $TDAQ_DB_DATA
For a graphical view of the partition select Edit/Partition. Left-click on objects to see their attributes, right-click on an object for a menu of possible actions (e.g.show relationships for that object). When re-sizing the display window it often needs to be refreshed. To do this, right-click on blank space and select Refresh.
For more information on the oks_data_editor a good (and still up-to-date) introduction can be found in slides presented at the Second Testbeam training for teams held May 2004.
8. Now you can run play_daq:
play_daq $TDAQ_PARTITION
Note: If you get inscrutable errors on starting play_daq it is often due
to a problem in the database. Running the oks_data_editor gives much more
verbose error information and should help to track down the problem. Occasionally
I have noticed that when the IGUI starts (especially when using larger configurations)
the DAQ Supervisor State will be displayed as "Configuring" and remain like
this. I suspect in these cases there is a problem reading the database. Usually
exiting and restarting clears the problem. To be understood.
9. When the IGUI starts, take the partition through the DAQ FSM. On Boot
all the EF applications are started. On Configure, the applications read
configuration information from the database and perform the necessary actions.
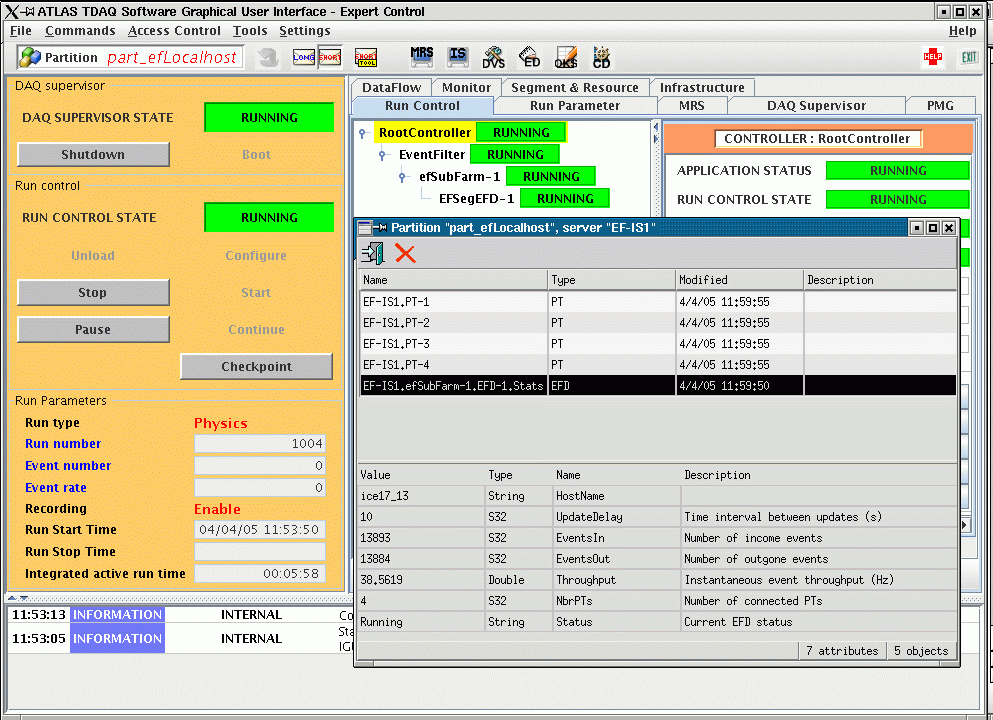
On Start the SFI emulator will start sending dummy events. You can check
that data is flowing through the EFD by starting the IS monitor (note that
when using an SFI emulator the event statistics are not written to the main
IGUI panel - this is only done when using the real SFI). Click the IS button
at the top of the IGUI. When the IS panel appears click on "Select Partition"
and select the name of your partition. The list of IS servers running in
that partition will then be displayed. Select the EF IS server by clicking
on "EF-IS1". Select the "Window" icon at the top of the panel (show available
information objects). This will give a list of all the information in the
server. You will see entries for one EFD and 4 PTs. If you click on the
EFD the statistics for that EFD will appear in the bottom panel of the window.
The instantaneous throughput should be non-zero and the EventsIn and EventsOut
should both be increasing. Here is an example of the IGUI in the "running"
state for an EF localhost partition, showing the IS information for the
EFD:
To terminate the partition, click on Stop to stop the SFI emulator sending
dummy events. On Unload the EF applications will undo the actions they did
on Configure. On Shutdown the EF applications are terminated. Click on Exit
at the top right-hand corner of the IGUI to kill the IGUI and shutdown the
Online SW infrastructure (various servers).
After exiting the log files for the applications are archived on the machine
on which they ran in the directory:
/tmp/backup/${USER}
10. Timing information for this partition can be obatined by running play_daq
with the time option, the no_gui option means that the the IGUI is not displayed:
play_daq $TDAQ_PARTITION time no_gui
One cycle (more can be specified I think ) of the DAQ FSM (including a
Pause and Resume) is performed and the timing information is printed at
the end:
Executing timing tests...
Booting DAQ ...
Waiting for RC to be in IDLE state ...
Start DAQ ...
Pause DAQ ...
Start DAQ ...
Stopping DAQ ...
Results: 0.217637 13.4832 2.67266 23.7074.
Stopping partition...
Stopping the DSA supervisor, this might take some time (30s timeout)!
4/4/05 12:54:49 INFO [dsa_stop_supervisor] DSA Supervisor safely stopped.
Stopped DSA Supervisor.
Stopped RC IS Monitor.
Stopped RC Tranistion Monitor.
Stopped MRS Audio Receiver.
Stopped MRS Receiver.
Problem stopping CDI via PMG (return value = 1)
Removed partition from Resource Manager.
PMG Agents killed all non-managed processes for partition part_efLocalhost.
Stopping all IPC based servers...
IPC servers stopped
*************************************************************
  dsashutdown_start_time 64
  shutdown_stop_time 68
  boot_start_time 21
Timing results:
---------------
Enter user comment for results log file (return = none):
sarahs test results
***
OnlineSW Timing tests for partition part_efLocalhost on ice17_13
Mon Apr  4 12:55:04 PDT 2005
      1 hosts defined in this database
3 run control applications used in this database
Command line parameters were: OBK:  CDI: yes
pmg testTime: 0 s
backend setup: 21 s
pure setup: 21 s
shutdown: 4 s
backend close: 2 s
boot: 3 s
cold start: 5 s
cold stop: 28 s
luke warm start: 2.67266 s
luke warm stop:  23.7074 s
warm start: 0.217637 s
warm stop:  13.4832 s
User comment:
sarahs test results
Test completed successfully in 70 seconds
The timing information is also written into the file:
/tmp/results/timing_test_result_list.out
on the machine on which you are running. Note that if you run a number
of timing tests, the results will be concatenated in this file.
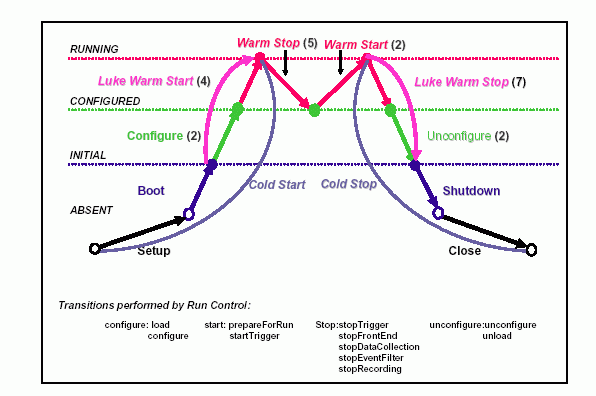
The correspondance of these times with the current DAQ FSM transitions
is a little convoluted. The following diagram should help:
1. On WestGrid it is first necessary to reserve the nodes via PBS. An example script to run a "sleep" job on the requested number of WestGrid resources can be found in:
/global/home/caronb/PBS/atlasEF_res.sh
To submit the job:
qsub atlas_RF.sh
Where necessary the number of nodes required and the total wall-time
for the reservation can be modified by changing the relevant lines in the
script:
#PBS -l walltime=24:00:00,nodes=5:ppn=2
will reserve both processors in 5 nodes for 24 hours
sleep 86400
the submitted job will sleep for 24 hours.
To check the status of the jobs submitted by Bryan:
qstat -nu caronb
Once the status changes to "running" indicated by an R entry in the output,
the list of allocated nodes on which the job is running will be shown, for
example:
teva.weteva.westgrid.ubc:
                                                            Req'd  Req'd   Elap
Job ID          Username Queue    Jobname    SessID NDS TSK Memory Time  S Time
--------------- -------- -------- ---------- ------ --- --- ------ ----- - -----
1148531.teva.we caronb   ice      atlasEF_re    --    5  --    --  72:00 R 03:27
   ice17_13/1+ice17_13/0+ice17_9/1+ice17_9/0+ice17_1/1+ice17_1/0+ice12_5/1
   +ice12_5/0+ice1_8/1+ice1_8/0
1149095.teva.we caronb   ice      atlasEF_re    --    5  --    --  72:00 R 01:58
   ice21_12/1+ice21_12/0+ice15_13/1+ice15_13/0+ice8_9/1+ice8_9/0+ice7_3/1
   +ice7_3/0+ice4_3/1+ice4_3/0
1149097.teva.we caronb   ice      atlasEF_re    --    5  --    --  72:00 Q   --
    --
1149099.teva.we caronb   ice      atlasEF_re    --    5  --    --  72:00 Q   --
    --
1149100.teva.we caronb   ice      atlasEF_re    --    5  --    --  72:00 Q   --
The first two requests are running and the last three are queued. The
names of the nodes on which the jobs are running are displayed, once per
CPU.
Once the list of reserved nodes is known, the node name should be written
into a .txt file (one might envisage a script to do this automatically).
This file will act as input to the next level database configuration script
(create_ef.bash). The purpose of the this script is to automate the generation
of the .cfg which is input to the .cfg file.
Note from Bryan: it's probably more efficient to put in several small requests
for reservation rather than one big one.
2. It gets a bit messy here, we have to run another setup script to create
the correct environment in which to run create_ef.bash. You could in fact
do this at the very beginning i.e. before all the steps listed in the previous
section (running localhost partition). But I thought I'd introduce it here
as it's a bit less confusing (I hope). First set an environment variable
to point to the scripts directory (in my home directory on WestGrid) and
then run the setup script:
ice17_13|gensetupScripts|47> setenv DF_SCRIPTS /global/home/swheeler/DC/scripts/v3r1p18
ice17_13|gensetupScripts|48> source $DF_SCRIPTS/setup.csh -o /global/home/caronb/atlas/tdaq-release/tdaq-01-01-00/installed -t i686-rh73-gcc32-opt -r
DataFlow setup sucessful:
TDAQ_INST_PATH     => /global/home/caronb/atlas/tdaq-release/tdaq-01-01-00/installed
DF_INST_PATH       => /global/home/caronb/atlas/tdaq-release/tdaq-01-01-00/installed
CMTCONFIG          => i686-rh73-gcc32-opt
TDAQ_DB_PATH       => /global/home/swheeler/DC/installed/share/data:/global/home/caronb/atlas/tdaq-release/tdaq-01-01-00/installed/share/data:/home/atdsoft/releases/tdaq-01-01-00/installed/share/data:/global/home/caronb/atlas/tdaq-release/tdaq-01-01-00/installed/databases:/global/home/caronb/atlas/tdaq-release/tdaq-01-01-00/installed/databases
DF_WORK            => /global/home/swheeler/DC
TDAQ_LOGS_PATH     => /global/home/swheeler/tdaq_logs
CMTROOT            => /afs/cern.ch/sw/contrib/CMT/v1r16
TDAQ_IPC_INIT_REF  => file:/global/home/caronb/atlas/tdaq-release/tdaq-01-01-00/installed/com/ipc_root.ref
Basically this is another way of setting up the tdaq-01-01-00 release,
but it also sets up some more environment variables needed by the create_ef.bash
script. If you want to learn more about $DF_SCRIPTS/setup.csh, call it with
-h switch (but at this stage you probably don't need to).
3. You are now ready to run create_ef.bash. Given the example shown in
point 1, the contents of your machines text file should look like:
ice17_13|gensetupScripts|33> cat machines-ice.txt
ice17_13
ice17_9
ice17_1
ice12_5
ice1_8
ice21_12
ice15_13
ice8_9
ice7_3
ice4_3
The naming convention for the file is machines-<name of testbed>.txt
If a machine becomes unavailable for some reason it can be commented out
temporarily from the list by preceding the name with a '#' followed by a
mandatory blank. So if say, ice17_9 and ice17_1 were unavaible the file would
look like this:
ice17_13
# Following nodes are dead
# ice17_9
# ice17_1
ice12_5
ice1_8
ice21_12
ice15_13
ice8_9
ice7_3
ice4_3
Use the create_ef.bash to generate a .cfg file. The valid options for create_ef
can be displayed using the -h switch:
# A script to generate EF partitions with SFI/O emulators
#
# ***** Note that for 'switch' options 0=false=off and 1=true=on *****
#
# -h                                        This help text
# -D                                        show DEBUG info                         [Quiet]
# -t <testbed>                              testbed                                 [32]
# -x                                        3 RC levels (one ctrl/EFD) [2 levels]   [0]
# -H <play_daq host(NOT in machine file)>   node starting play_daq                  [ice17_13]
# -c <EFDConfiguration>                     EFD configuration name                  [efd-cfg-in-ext-out]
# -e <#EFDs per node>                       # of EFDs per node                      [1]
# -f <EFDs per sub farm>                    #EFDs per sub farm                      [32]
# -s <PT result size>                       PT result size in bytes                 [1024]
# -b <PT burn time>                         PT burn time in us                      [1000000]
# -a <PT accept rate>                       PT  accept rate, 0.0-1.0                [0.1]
# -p <#PTs per EFD>                         # of PTs per EFD                        [4]
# -F <no of EF sub farms>                   # of EF sub farms                       [1]
# -I                                        One IS server per sub-farm              [0]
# -d <ISUpdateInterval in seconds>          update interval for IS objects          [20]
# -S                                        Stop after cfg, dont create xml         [0]
# -u                                        Use Dedicated EFD nodes from the hostlist [0]
#
# The name of the partition (and cfg) file reflects the settings for -F <F> -f <f> -e <e> -p <p> -x -I
# so that the cfg file would be <F>SF<f>x<e>xEFD<p>PT_<logical>RC_<logical>IS,
# where <logical> is the logical values 0 or 1, see top of this help text.
# For these settings the first base name would be 1SFx32x1EFDx4PT_0RC_0IS.cfg
#
An example:
ice17_13|gensetupScripts|70> ./create_ef.bash -t ice -f 4 -F 1
INFO create_ef.bash: *** One controller/EFSubfarm ***
./create_ef.bash: line 1: ANY_HOST[]: bad array subscript
INFO find_nodes(): A total of 10 hosts found in machines-ice.txt. Their use is:
   INFO find_nodes(): 10 ANY_HOST hosts found
INFO create_ef.bash: 10 nodes required for configuration
INFO create_ef.bash: part_1SFx4x1EFDx4PT_0RC_0IS: 1 subfarms, 4 EFD nodes, 1 EFDs/node, 4 PTs/EFD
INFO create_ef.bash: nbEFFarms=1, nbEFDnodes=4, TOTAL=24 applications on 10 nodes
INFO create_ef.bash: generating partition part_1SFx4x1EFDx4PT_0RC_0IS, gensetup output to /tmp/createDB_swheeler.out/cfg
reading node info from: /global/home/swheeler/DC/DBGeneration/v1r1p33/gensetupScripts/machines-ice.txt
found 0 nodes in file

Setting binary tag to i686-rh73-gcc32-opt.
Generate DCAppConfig and DC_ISResourceUpdate for EF-IS1.
Dummy SFI SFI-1 has address ice12_5:10000.
Dummy SFO SFO-1 has address ice1_8:11000.
Generate 1 EFDs on 1 nodes.
SFIs are: SFI-1 SFOs are: SFO-1
Generate 1 EFDs on 1 nodes.
SFIs are: SFI-1 SFOs are: SFO-1
Generate 1 EFDs on 1 nodes.
SFIs are: SFI-1 SFOs are: SFO-1
Generate 1 EFDs on 1 nodes.
SFIs are: SFI-1 SFOs are: SFO-1
Generate EF_SubFarm 1 with 4 EFDs and 16 PTs.
 Controller will run on ice17_1.
 IS server number is 1.
Generate top segment for EF.
 We have 1 sub-farms
 and 1 EF-IS servers
 and 2 other applications.
 Top EF controller on ice4_3.
Generating partition object part_efTest

Verification of timeouts.
  Parameters found:
Timeouts verified.

Verification of ROS memory clears.
  Parameters found:
ROS memory clears verified.

Done!
will use the list of machines in machines-ice.txt to create a 1 sub-farm
system with 4 EFDs. The rest of the parameters will be the defaults shown
above. Before the script creates the .cfg it will calculate the number of
hosts required for the specified configuration and exit with an error if
there are not enough in the machines.txt file (there is a bug in the script
which slightly overestimates the number of machines required for a configuration
- to be fixed). I have changed the create_ef script very slightly to always
write the .xml partition file with the same name, part_efTest.data.xml (this
is my personal bias when running partitions by hand). For automatic generation/running
we probably should use the default name (which gives a name based on a summary
of the actual configuration, in the above case it would be: part_1SFx4x1EFDx4PT_0RC_0IS,
also see explanation in help text) as this makes it easier to trace logging
information following automatic running (but this is for later). Note that
there is an errors reported by the script which I suspect is due to the
unusual naming scheme of the ice nodes: to be investigated. The resulting
files look fine though.
4. Make sure your running environment is set correctly:
setenv TDAQ_PARTITION part_efTest
setenv TDAQ_DB_PATH $YOUR_DB_PATH:$TDAQ_DB_PATH
setenv TDAQ_DB_DATA $YOUR_DB_PATH/$TDAQ_PARTITION.data.xml
setenv TDAQ_IPC_INIT_REF file:$YOUR_IPC_DIR/ipc_init.ref
5. Run play_daq as described in the previous section. If you select the
pmg panel after the Boot command you will now see all the pmg agents on
the allocated nodes. Click on any agent to see the applications running
on that node. See the screenshot below for an example: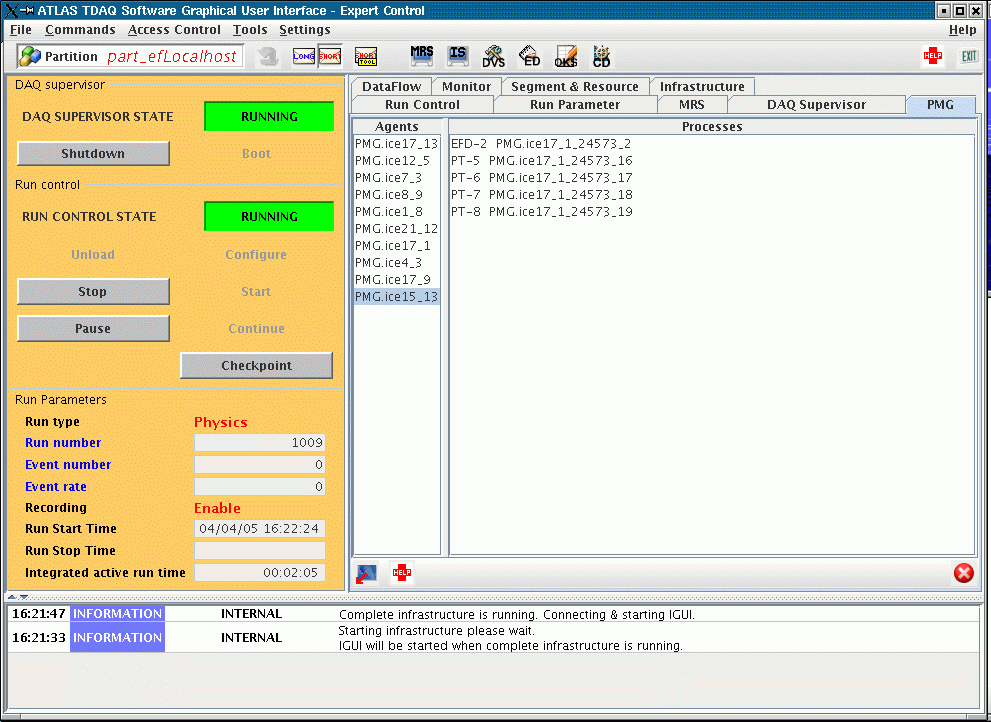
6. One aim of the large scale tests is to see whether there are timing
penalties imposed by having a 3-tier as opposed to 2-tier run control hierarchy.
It is very simple for create_ef to switch between these two configurations
using the -x switch. Without it (as above), generates a .cfg file for a
2-tier hierarchy, with it, as below generates, a 3-tier hierarchy:
ice17_13|gensetupScripts|105> ./create_ef.bash -t ice -f 4 -F 1 -x
INFO create_ef.bash: *** One controller/EFSubfarm AND one controller/EFD***
./create_ef.bash: line 1: ANY_HOST[]: bad array subscript
INFO find_nodes(): A total of 10 hosts found in machines-ice.txt. Their use is:
   INFO find_nodes(): 10 ANY_HOST hosts found
INFO create_ef.bash: 10 nodes required for configuration
INFO create_ef.bash: part_1SFx4x1EFDx4PT_1RC_0IS: 1 subfarms, 4 EFD nodes, 1 EFDs/node, 4 PTs/EFD
INFO create_ef.bash: nbEFFarms=1, nbEFDnodes=4, TOTAL=24 applications on 10 nodes
INFO create_ef.bash: generating partition part_1SFx4x1EFDx4PT_1RC_0IS, gensetup output to /tmp/createDB_swheeler.out/cfg
reading node info from: /global/home/swheeler/DC/DBGeneration/v1r1p33/gensetupScripts/machines-ice.txt
found 0 nodes in file

Setting binary tag to i686-rh73-gcc32-opt.
Generate DCAppConfig and DC_ISResourceUpdate for EF-IS1.
Dummy SFI SFI-1 has address ice12_5:10000.
Dummy SFO SFO-1 has address ice1_8:11000.
3rd level CTRL ['ice21_12']
Generate 1 EFDs on 1 nodes.
SFIs are: SFI-1 SFOs are: SFO-1
3rd level CTRL ['ice15_13']
Generate 1 EFDs on 1 nodes.
SFIs are: SFI-1 SFOs are: SFO-1
3rd level CTRL ['ice8_9']
Generate 1 EFDs on 1 nodes.
SFIs are: SFI-1 SFOs are: SFO-1
3rd level CTRL ['ice7_3']
Generate 1 EFDs on 1 nodes.
SFIs are: SFI-1 SFOs are: SFO-1
Generate EF_SubFarm 1 with 4 EFDs and 16 PTs.
 Controller will run on ice17_1.
 IS server number is 1.
Generate top segment for EF.
 We have 1 sub-farms
 and 1 EF-IS servers
 and 2 other applications.
 Top EF controller on ice4_3.
Generating partition object part_efTest

Verification of timeouts.
  Parameters found:
Timeouts verified.

Verification of ROS memory clears.
  Parameters found:
ROS memory clears verified.

Done!
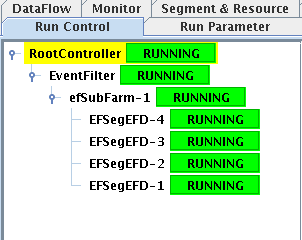
The difference in configuration is illustrated by the run control tree
displayed in the Run Control panel of the IGUI for the 2 types of configuration:
2-tier hierarchy
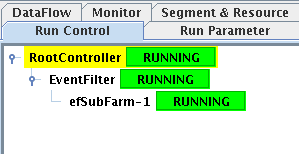
3-tier hierarchy
7. Timing measurements can be made by hand as described before.
1. When running multiple sub-farms it is useful to have a summary of the operational statistics for each sub-farm. If sub-farms are of equal size and consist of identical machines one would expect the summary information to be the same for each sub-farm. Statistics can be summed for all EFDs in each sub-farm by adding the Gatherer application to the partitions. As mentioned in the first section, the private binary patches for the Gatherer are already taken into account by defining the RepositoryRoot relationship in the partition and the Gatherer segment is also already included in the partition, but disabled. All that remains to be done is to enable the Gatherer segment.
2. The Gatherer segment can be enabled from the Segment
& Resource panel of the IGUI. Start play_daq as before. Once the IGUI
is displayed and before booting the partition select the Segment & Resource
panel. The two top level segments are displayed (see below). The top-level
EF segment which is enabled and the Gatherer segment which is disabled.
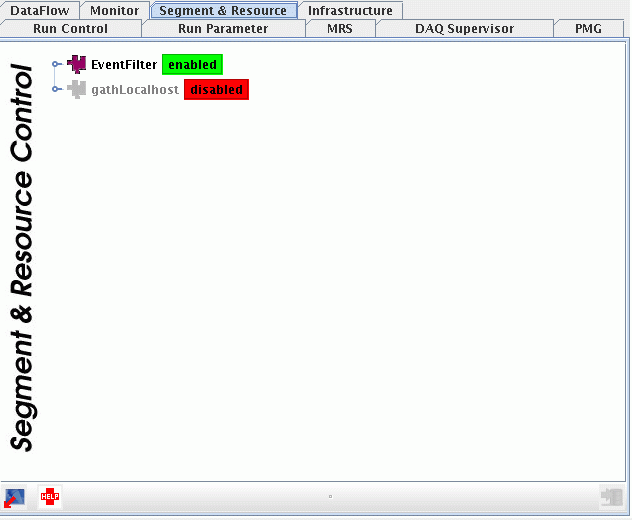
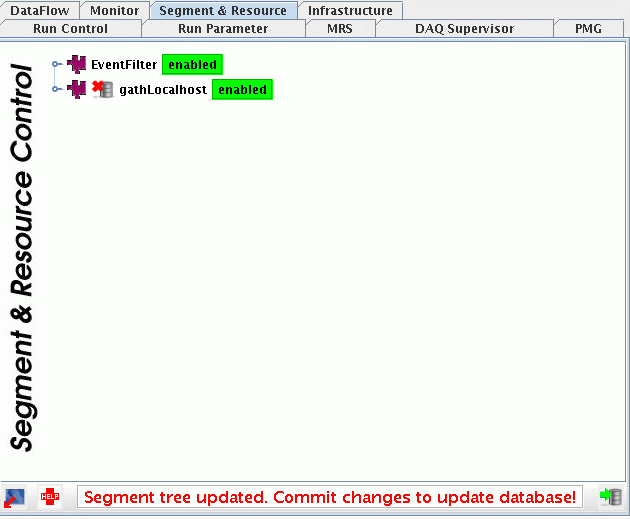
3. Enable the Gatherer segment by right-clicking on
the word disabled and selecting "Enable segment gathLocalhost" from the
menu. The change must then be saved to the database by clicking on the icon
at the right-hand bottom corner of the panel (see below):
Note: The database will only be saved on the machine on which the the
IGUI is running. This is OK if we are using the shared-file system. If/when
we move to having local copies of the database file on all machines it will
be necessary to copy the file to all machines (e.g. using rgang) once the
save has been made. If DAQ Supervisor State gets stuck in "Configuring" after
you have made the save, exit from the IGUI and start again. This should clear
the problem - to be understood.
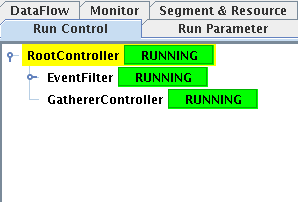
4. Now start the system as before, once in the "Running"
state the run control tree should look like this:
5. The functionality of the Gatherer can be verified
by looking at its output in the IS server. Start 2 copies of the IS server.
For the first copy select the EF-IS1 server and choose one of the EFDs.
For the second copy choose the Histogramming server, choose the gatherer
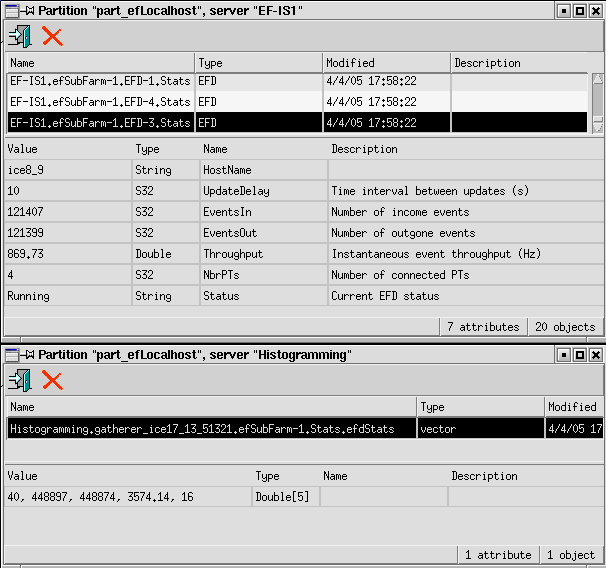
entry for efSubFarm-1. The gatherer entry is a vector which contains a sum
of all the numerical IS information for all the EFDs in the subfarm. In
the example shown below there are 4 EFDs in the sub-farm, the summed output
statistics displayed by the Gatherer are ~4 times those for the single EFD:
6. There is a text utility (is_ls) which may also to be used to display
IS information:
ice17_13|gensetupScripts|53> is_ls -h
Usage: is_ls [-p partition-name] [-n server-name] [-R regular-expression]
             [-v] [-N] [-T] [-D] [-H]
Options/Arguments:
        -p partition-name       partition to work in.
        -n server-name          server to work with.
        -R regular-expression   regular expression for information to be
                                printed.
        -v                      print information values.
        -N                      print names of information attributes (if
                                available).
        -T                      print types of information attributes.
        -D                      print description of information attributes
                                (if available).
        -H                      print information history (if available).
Description:
        Lists Information Service servers in the specific partition
        as well as the contents of the servers
The following command will show the Throughput value for all EFDs running
in the partition:
 ice17_13|gensetupScripts|54> is_ls -p $TDAQ_PARTITION -n EF-IS1 -v -N | egrep 'Throughput|EFD'
    EF-IS1.efSubFarm-1.EFD-2.Stats.efdStats <5/4/05 10:37:44> <EFD>
      Throughput        888.917
    EF-IS1.efSubFarm-1.EFD-1.Stats.efdStats <5/4/05 10:37:44> <EFD>
      Throughput        886.513
    EF-IS1.efSubFarm-1.EFD-4.Stats.efdStats <5/4/05 10:37:44> <EFD>
      Throughput        889.816
    EF-IS1.efSubFarm-1.EFD-3.Stats.efdStats <5/4/05 10:37:44> <EFD>
      Throughput        883.016
This will show the output from the Gatherer:
ice17_13|gensetupScripts|65> is_ls -p $TDAQ_PARTITION -n Histogramming -v -N7. A graphical display of IS information can be obtained using the islogger (see documentation) utility:
Server "Histogramming" contains 1 object(s):
Histogramming.gatherer_ice17_13_199641.efSubFarm-1.Stats.efdStats <5/4/05 10:59:45> <vector>
1 attribute(s):
40, 48388, 48359, 3521.7, 16
ice17_13|gensetupScripts|67> islogger &
[2] 21626
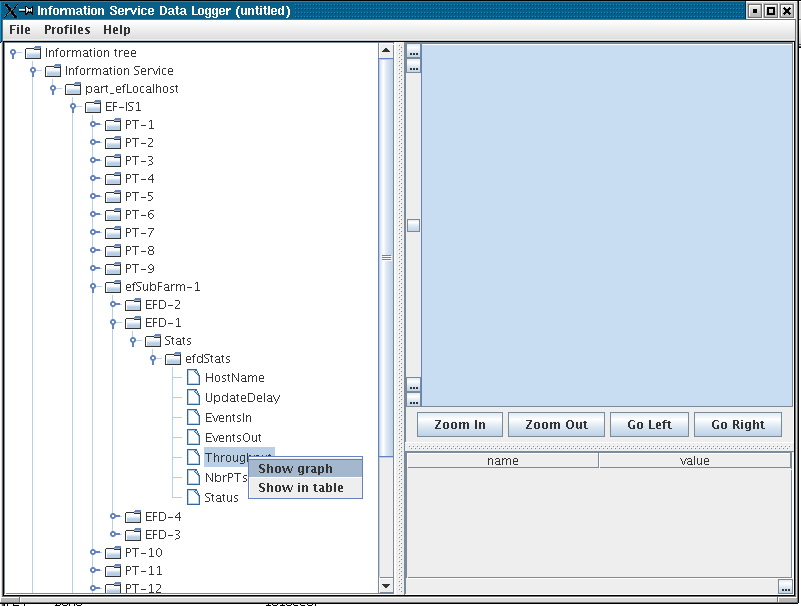
The information to be displayed can be chosen from the hierarchy of IS
information:
And a continually updating graph obtained (in this case Throughput for EFD-1):
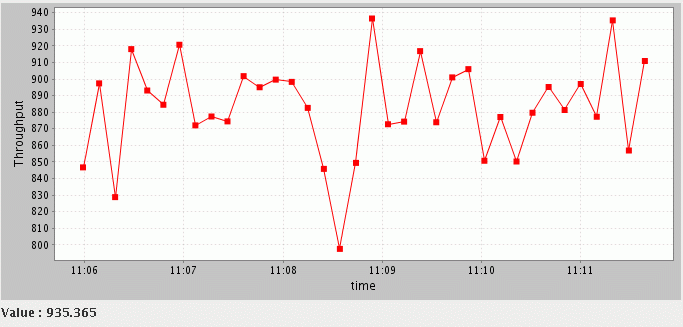
It is possible to display simultaneously plots of several different parameters.
Drawbacks are:
When only limited hardware resources are available, for the purposes of
large scale testing it is useful to be able to run more than 1 EFD (and associated
PTs) per node in order to simulate a larger system. (Note that running more
than 1 EFD per node is not currently envisaged as a requirement for the final
system). When running multiple EFDs the communication between each set of
EFD and its PTs must be implemented via a uniquely named (for that node) socket
and shared heap. This is all taken care of by the database generation scripts.
It wasn't quite implemented before I came here - I had to make small changes
to both the create_ef.bash script and the gen_EFsuite.py module of gensetup.
Do:
diff gen_EFsuite.py gen_EFsuite.py.05Apr05
diff create_ef.bash create_bash.01Apr05
to see the changes made. Currently the scripts support a maximum of 4 EFDs
per node. This is probably a sensible limit in order not to run into problems
with resources. An example of call to create_ef is shown below where the
number of EFDs per node is set to 4:
./create_ef.bash -t ice -e 4 -f 32 -F 2
This command will create a 2 sub-farm system, with 32 EFDs per sub-farm
and 4 EFDs per node. Therefore each sub-farm consists of only 8 nodes. Multiple
EFDs per node are specified in the .cfg file by quoting the required number
in square brackets (with no blank between EFD and the leading bracket), for
example:
EF EFD[4] ice15_13 efd-cfg-in-ext-out 4 SFI-1 SFO-1
If only 1 EFD is required either the number in square brackets is set to
1 or they are omitted altogether, e.g.
EF EFD ice15_13 efd-cfg-in-ext-out 4 SFI-1 SFO-1
An example of the pmg panel when running 4 EFDs per node is shown below:
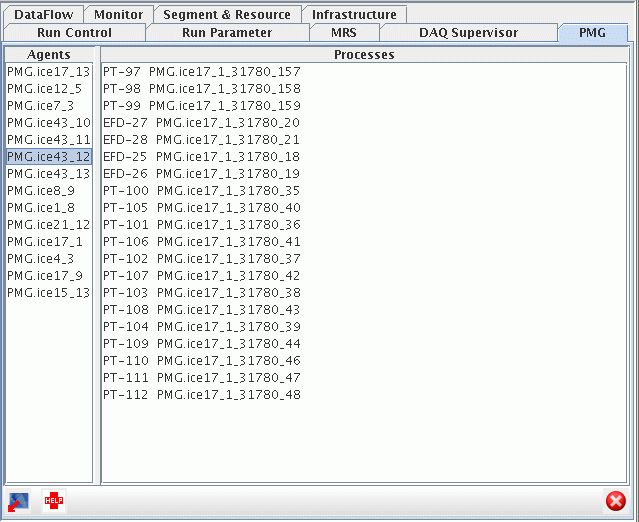
When running large configurations and/or making timing tests in order to
avoid possible problems with the shared file system the partition file (and
the files which it includes) should be copied to the local disk of each machine
in the configuration. Not only is it necessary to copy the .xml file created
by create_ef.bash but all the .xml files to which it refers (these are in
the tdaq release, also the gatherer .xml files in my home director. Maybe
Bryan could investigate how best to go about making the copy (with rgang
etc.)
When working with local installations of the database remember that your
TDAQ_DB_DATA and TDAQ_DB_PATH environment variables must be reset accordingly.
ice17_13|gensetupScripts|38> dvs_gui $TDAQ_DB_DATA -p $TDAQ_PARTITION
It provides a GUI (see below) to display log files from all the machines
in the configuration. It avoids the need to ssh to each machine in order
to find the files:
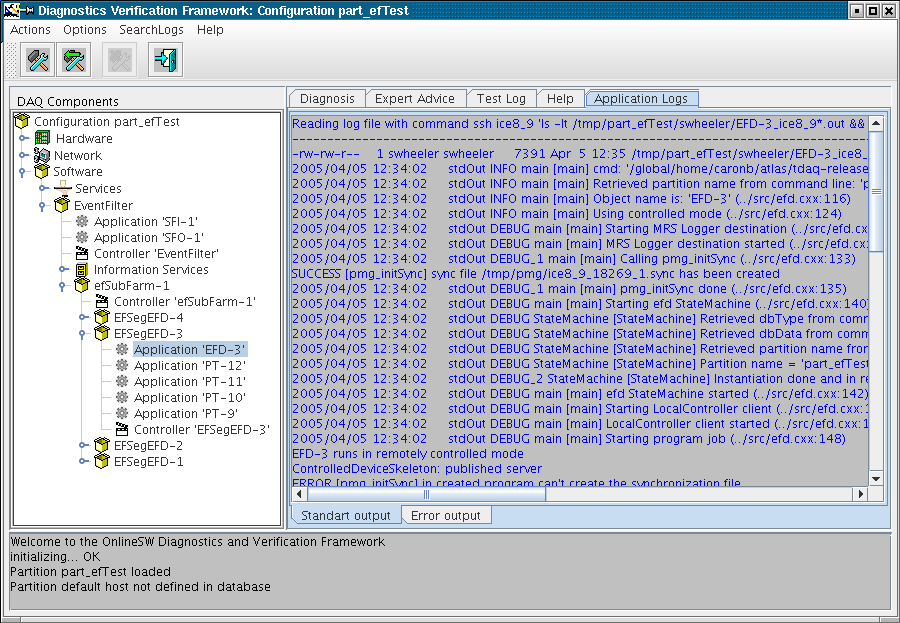
Note: You will not be able to start the DVS browser if you setup your environment
using $DF_SCRIPTS/setup.csh. For some reason it will be trying to look for
something on afs and will fail - to be investigated. If you want to use the
DVS browser I suggest you start a separate session on the same machine, run
the tdaq setup script directly:
source /global/home/caronb/atlas/tdaq-release/tdaq-01-01-00/installed/setup.csh
and the run the dvs_gui as shown above. This should work.
2. rgang is a useful tool for managing files, issuing commands etc. on
multiple machines, in a fast, parallel fashion. To use it on WestGrid, put
it in your path:
ice17_13|swheeler|50> setenv PATH /global/home/caronb/atlas/tools/rgang/bin:${PATH}
For more information check the README files in /global/home/caronb/atlas/tools/rgang. An example, showing how to clear all log files for the part_efTest partition is the following:
ice17_13|gensetupScripts|57> rgang.py -x machines-ice.txt "rm -r /tmp/part_efTest"
ice17_13= ice17_9= ice17_1= ice12_5= ice1_8= ice21_12= ice15_13= ice8_9= ice7_3= ice4_3= ice17_13|gensetupScripts|58>
The -x option stops the printing of errors of the form:
ice32_11= Warning: No xauth data; using fake authentication data for X11 forwarding.
/usr/X11R6/bin/xauth:  error in locking authority file /global/home/swheeler/.Xauthority
We should copy over the scripts directory from Antonio Sobreira's area - there's some useful stuff /cluster/home/sobreira/scripts. For example, in case of a messy shutdown of a configuration, their may be leftover applications running on some machines. The "show" script can be called with rgang to display all the processes on all the machines in the specified file that belong to a particular user:
rgang.py -x machines-ice.txt "/global/home/swheeler/scripts/show -u swheeler" > procs
Currently the full path name to the script has to be given, even if the
scripts directory is put in PATH in the shell login. There is a bug somewhere
which Antonio is investigating.
rgang has also been modified so that it understands the convention used
by create_ef by which machine names are commented out in the machines.txt
file (# followed by a blank). If the name is commented out, rgang will not
attempt to run the command on that machine.
3. For cleaning up partitions (i.e. killing absolutely everything including
OnlineSW infrastructure servers etc.) we have the "nuke" utility from Gokhan
(he developed this for use in the CTB). It is currently installed in my home
directory: /global/home/swheeler/tools and is invoked thus:
./nuke $TDAQ_DB_DATA
Internally it runs "fuser" which is in the same directory. I'm not sure
how it works, but it does seem very effective. One possible drawback is that
it is looking for (I think) binaries from the standard installation area.
Anything in external private patches won't be considered. At the moment this
is just the Gatherer application which sits in the InstallArea of my home
directory on WestGrid.
If you are in any doubt about orphan applications being left over
after a messy shutdown I urge you to use this!!! We wasted a huge
amount of time last March due to messy shutdowns and lack of tools to tidy
up. It does kill all pmg_agents which will then need to be started next time
you run play_daq (tedious).
4. More... I'm sure
Still to be tested
There are scripts/procedures available to automate analysis. I have not
had time to become familiar with any of this yet. Will look into this on returning
to CERN.
The actual CPU configuration on which I made the tests is here. Obtained by running:
qstat -nu caronb
This was used to generate machines-wg.txt
which was used as input for the 2 tests listed below. Note that when both
CPUs of the same processing node have been allocated it is only listed once
in the machine file.
Also there is a bug in PMG IGUI panel - to be investigated. The naming
scheme for the ice nodes on WestGrid is the following:
icexx_yy
where xx is the crate number (1-50?) and yy is the node number in the crate
(1-14). When there is a process started on node:
icexx_1
it appears also to be started on nodes:
icexx_10
icexx_11
icexx_12
icexx_13
icexx_14
It is only a display problem. The actual running configuration is correct.
Therefore nodes with names of the form icexx_1 can be included in the configuration.
./create_ef -t wg -p 1 -f 10 -F 10
Produces a configuration with 10 sub-farms, 10 nodes per sub-farm, 1 EFD,
1 PT per node.
.cfg file
gatherer_results
runcontrol_timing
screenshot
Here is an extract from the gatherer results file. The file contains the
sum of the EFD statistical information for each sub-farm, at approximately
1 minute intervals. The sum for each sub-farm is shown as a vector of values.
From left to right the values are: IS update time (not very sensible to sum
this, but it just happens), Events In, Events Out, Instantaneous Throughput,
Number of PTs connected to an EFD. Note: there is a bug with summing for efSubFarm-1.
What is displayed is actually the sum of efSubFarm-1 + efSubFarm-10.
So the Troughput for efSubFarm-1 is really: 7359.06 - 3386.42 = 3972.64
    Histogramming.gatherer_ice35_11_159269.efSubFarm-10.Stats.efdStats <7/4/05 11:59:55> <vector>
    1 attribute(s):
                        100, 92557, 92497, 3386.42, 10
    Histogramming.gatherer_ice35_11_159264.efSubFarm-1.Stats.efdStats <7/4/05 11:59:55> <vector>
    1 attribute(s):
                        200, 200057, 199939, 7359.06, 20
-ORBthreadPerConnectionPolicy 0 -ORBmaxServerThreadPoolSize 10
had to be added to each instance of the rdb_server in the daq setup segment in:
/global/home/caronb/atlas/tdaq-release/tdaq-01-01-00/installed/databases/daq/segments/setup.data.xml
Generated thus:
./create_ef.bash -t wg -p 2 -f 10 -F 10
.cfg file
gatherer_results
runcontrol_timing
screenshot - looks exactly the same as above
Once the TDAQ_IPC_TIMEOUT parameter was increased it was possible to run
an even larger system (4 PTs per node). The default value for TDAQ_IPC_TIMEOUT
is 30 seconds and the Configure step was timing out. The timeout was increased
for both PTs and the LocalControllers (lowest level of Run Control). I suspect
it may only have been necessary to make the change for the LocalControllers.
I had to change gen_db.sh (to include a file which defines the environment
variable and set it to 100000ms i.e. 100 seconds) and gen_EFsuite.py (in
gensetupScripts) so that the controller and PT objects point to the environment
variable. I kept the command line options for the rdb_servers the same as
they are described above.
The configuration was generated thus:
./create_ef.bash -t wg -p 4 -f 10 -F 10
This configuration ran correctly and the output statistics can be seen
following the link below. Note: the configuration step takes around 60 seconds.
I was unable to make timing measurements. Note that the subfarm controllers
give warnings at startup. Thiss is only due to the fact that this timeout
has been changed. Running play_daq with the time option, did not work due
to timeouts. I expect there is a timeout option I have to increase somewhere
- to be investigated.
gatherer_results
screenshot (yes it really
does work!)
Note: This test has shown that it is possible to run a "standard" EF configuration
on a system consisting of 100 separate WestGrid processing nodes.
I subsequently tried running larger configurations by doubling up EFDs per node. For instance, I tried a configuration with 15 subfarms:
./create_ef.bash -t wg -e 2 -p 4 -f 10 -F 10
This and other larger configurations are failing. It's possible (?) I'm
beginning to run into file descriptor problems. For instance running the
command Bryan provided me:
ls -l /proc | grep $USER | awk -F " " '{ print "ls -R /proc/"$9"/fd/ | wc -l" }' > nfile ; source ./nfile
I see that some processes are using over 900 file descriptors. Once the number of file descriptors on WestGrid has been increased you could try running this configuration again and see if it is any better.
However, I think I am also beginning to see scaling problems due to the
LocalController - the problems appear to get worse with the number of applications
the LocalController has to manage. I'm also not familar enough with the the
tuning required in the OnlineSW for large scale testing. I exchanged emails
with Igor and Sergeui at CERN today regarding the tuning - I tried to implement
what they suggested (the modified setup segment I created is here, email from Igor here)
but it was not helping - and in fact some of the time it appeared to make
things worse, e.g. the boot step timing out.
If you wish to try with the modified setup segment, one way to do it is
generate your database as above and then edit the .xml file changing the
line:
<file path="daq/segments/setup.data.xml"/>
to:
<file path="/global/home/swheeler/setup.data.xml"/>
assuming you are going to pick up my modified version of the file. Another
way is to copy it (making sure you have saved a copy of the original first!)
to the standard release area:
/global/home/caronb/atlas/tdaq-release/tdaq-01-01-00/installed/databases/daq/segments/setup.data.xml
Other issue: is it possible to run the islogger locally? Need a local
installation of java and the tdaq-01-01-00 release and a reference to the
TDAQ_IPC_INIT_REF of the global ipc_server on WestGrid. To test this you
would run the setup.csh for the release. Set the TDAQ_IPC_INIT_REF and run
it with the command is_logger.
Final Note: Both the OnlineSW tuning and LocalController issues I will
follow up in detail at CERN.
Another Final Note: Roger was saying that it might also be feasible to
run some tests on THOR provided we configure the dummy PTs not to take up
too much CPU time.
Last update by S.Wheeler 15th April 2005